Standard Setting [English Version]
/ 11 min read
All types of assessment must answer the following Six Questions: Who/Why/What/How/When/Where
The assessment’s Six Questions
Who should assess the students?
The first important question is: Who should be responsible for assessing students?
Looking at a medical curriculum, we can see that there are many stakeholders, for example:
- International accrediting bodies such as WFME, which oversee program accreditation but may not directly evaluate individual students.
- National accreditation bodies such as TMC, CMA, and the Medical Council (ศรว.). These organizations certify knowledge and competencies necessary for professional practice, so they must assess medical students.
- Professional bodies such as Thailand’s royal colleges (The royal colleges in Thailand). Their roles are similar in that they certify specialized professional competencies specific to each college.
- Affiliated universities. The university itself must assess whether students have achieved the competency required to graduate.
- The department, course committee. Departments evaluate whether students achieve the learning objectives for each course.
- The individual teacher. Each teacher evaluates whether students attain the specific objectives they are responsible for.
- Other healthcare professionals. Interprofessional assessment is essential because medical students must work collaboratively with other professions. Observations from different professional perspectives enhance medical students’ ability to collaborate in a healthcare team.
- The public and patients. Since patients and society are directly affected by a medical student’s work, they have the right to take part in the assessment process.
- The students themselves. Ultimately, students should assess themselves so they are always aware of their own progress and status.
The group that tends to be least accurate in evaluation is the students themselves (self-assessment). It has even been said:
The worst accuracy in self-assessment among physicians who were the least skilled and those who were the most confident… - Davis DA (2006)1
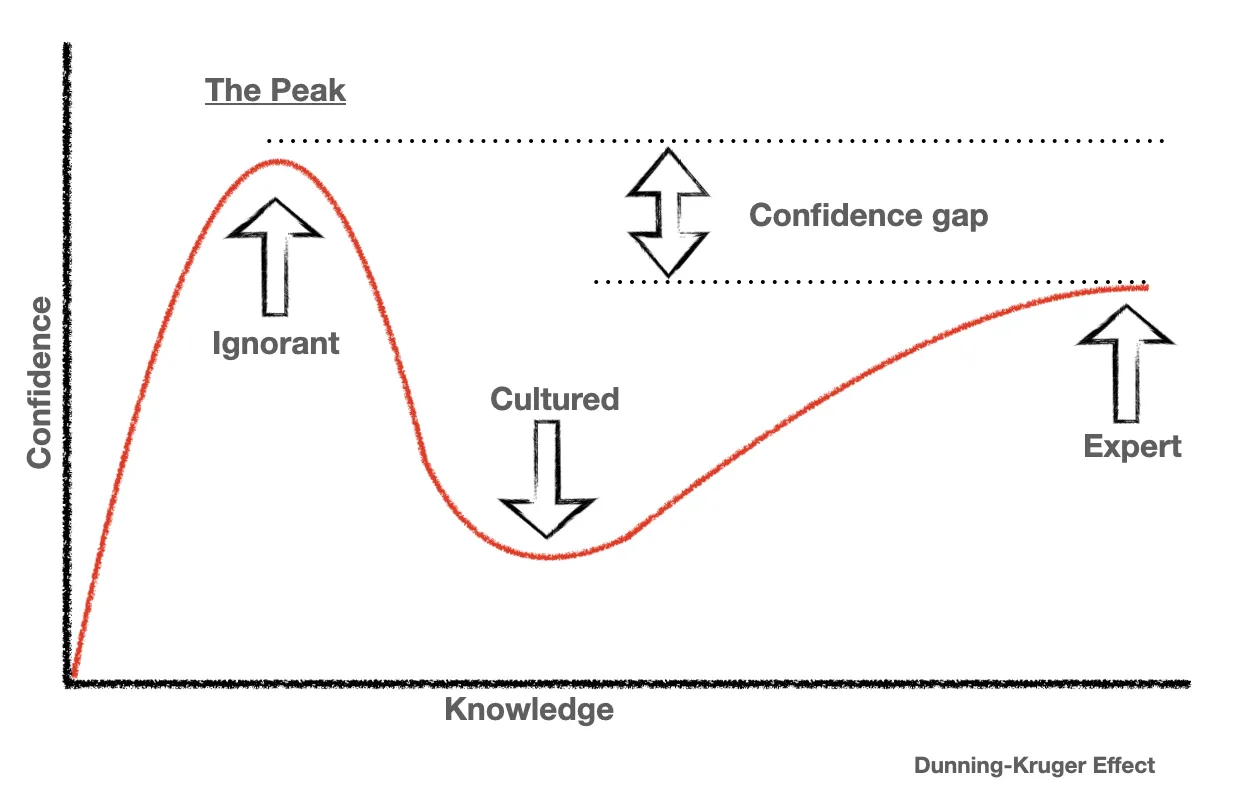
This aligns with the Dunning-Kruger Effect.
 Image from 2
Based on the theory by Justin Kruger and David Dunning (1999), early in learning, a person’s confidence can be very high even though their actual knowledge is minimal. But as one learns more, they start to see how much they still do not know, leading confidence to plummet. With continued learning, confidence gradually returns but usually never reaches the same inflated level as at the very beginning. This mirrors medical students who, upon first encountering a new topic, may feel confident because they think they have mastered it—only to discover later there is much more to learn, causing a drop in confidence that slowly rebounds with further study3
Dove VS Hawk
Assessors can generally be divided into two archetypes—comparable to the dove and the hawk:
- Dove: lenient, granting near-perfect scores.
- Hawk: stringent, giving low scores even when the performance is quite good.
Why assess the students?
There are many objectives or purposes for student assessment, such as:
- Fit for purpose: Meeting professional standards.
- Assessing the students’ progress: Evaluating students’ developmental progress.
- Enhancing the student’s learning: Using assessment to foster learning and assess learning outcomes.
- Grading or ranking: Identifying top-performing students (norm-referenced).
- Motivate learners: Using assessment to drive student motivation.
- Information for decision-making: Using assessment results to inform decisions.
- Certification of competence: Certifying the student’s level of competency.
- Providing feedback, faculty evaluation: Giving feedback or evaluating the institution.
- Curriculum evaluation/improvement: Assessing and enhancing the curriculum.
- Bringing about assessment-led innovation.
What should be assessed?
Referring to Miller’s Pyramid of Clinical Competency, we can evaluate three domains of clinical competency: Knowledge, Skills, and Attitude.
 Image from4
In addition, other aspects can be assessed, such as Professionalism, Independent Learning, and Self-Assessment Skills.
How should the student be assessed?
Qualities of a good assessment
- Valid (measures accurately what is intended)
- Reliable (consistent results)
- Equivalent (fairness across contexts)
- Feasible (practical to implement)
- Educational impact (influences learning positively)
- Acceptable (well-received by stakeholders)
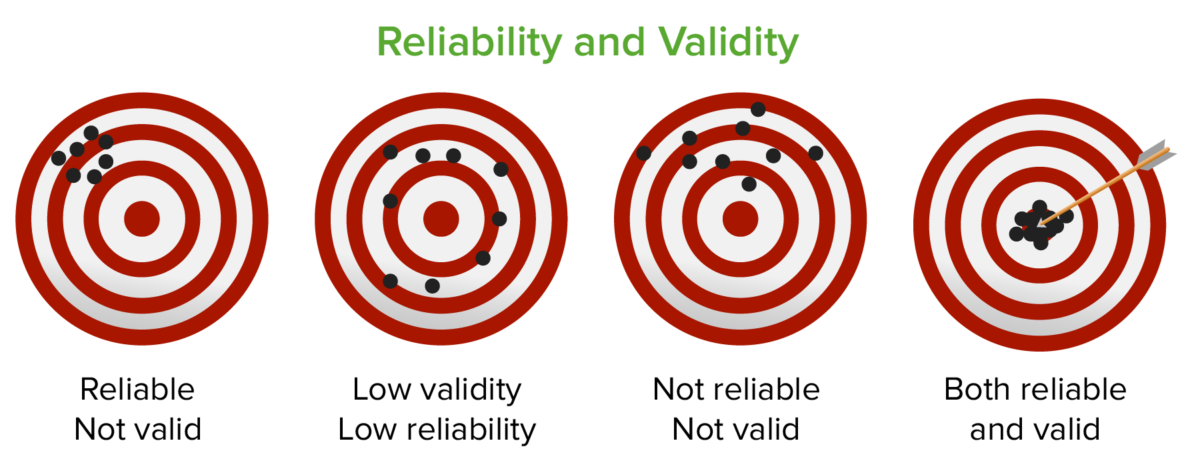
Validity and Reliability5
 Image from5
Valid means the assessment accurately measures what it is intended to measure. Reliable means the assessment yields consistent results when repeated under the same conditions.
Value of assessment6
Utility = Reliability x Validity x Feasibility x Educational impactWhen should the student be assessed?
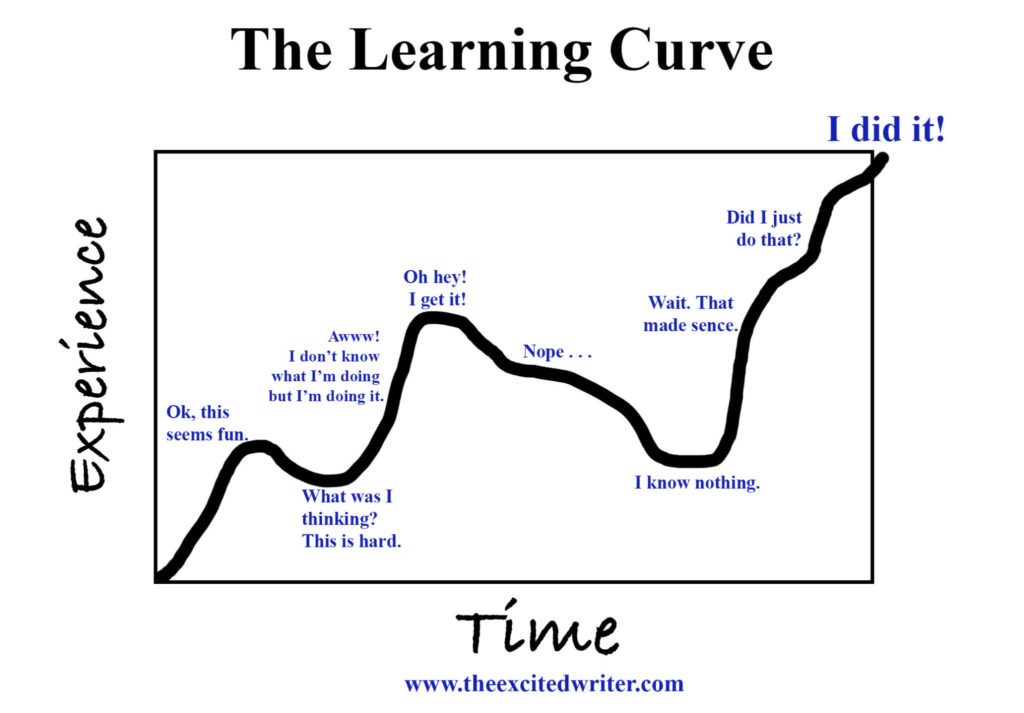
 Image from7
From the learning curve above, assessment can be integrated at all stages of learning:
- In-course assessments, which focus on developmental progress during learning.
- End-of-course assessments, which evaluate final learning outcomes.
- Progress Tests, which compare students’ progression over time, such as yearly tests in residency programs where each year may have different assessment criteria.
Where should the student be assessed
This depends on the exam format and the type of assessment:
- Exam hall: A dedicated environment for formal examinations.
- Simulation center: Assessment through simulated scenarios.
- WPBA (Workplace-Based Assessment): Ongoing evaluation in real work settings.
Types of assessment
- Diagnostic
- Formative
- Summative
Diagnostic Assessment Used to determine what kind of educational intervention is needed, for example, assessing English proficiency to place students at the appropriate level before instruction.
Formative Assessment Assessment during the learning process. The main purpose is providing feedback. There is no pass or fail but rather determining strengths and areas for improvement. This method fosters ongoing learning. Common examples include WPBA tools such as mini-CEX and DOPS.
Summative Assessment Exams that determine pass or fail outcomes (e.g., end-of-course exams).
Standard setting
On a test, a standard or cutpoint is a special score that serves as the boundary between those who perform well enough and those who do not. - Norcini, J. J. (2003)8
In this context, Standard refers to the score that determines whether a student’s performance is acceptable or not—essentially, whether they pass or fail.
Type
- Norm - Referenced (Relative) Uses the group’s overall performance (e.g., ranking students and then deciding a cutoff). An example is admissions testing, where seats are limited.
- Criterion-Referenced Predetermines a specific standard that clearly indicates pass or fail. Commonly used to determine whether someone has mastered certain skills or knowledge (as in many educational programs).
Norm vs Criterion
Norm
- Provides limited information about whether a student truly knows the content.
- The cut-score can vary widely depending on the specific group of examinees.
- The rationale for the cut-score can be harder to justify.
- Good for selection processes where only a certain quota can pass.
Criterion
- Suitable when the intent is to evaluate mastery (pass/fail).
- Clearly measures specific skills or knowledge.
Standard Setting
Standard Setting is the process of determining the pass/fail standard (cutpoint) that indicates whether a candidate meets the required competency level.
Stand setting methods 4 categories
- Test-centered methods Focus on the exam items themselves. Review how borderline students (at the pass/fail threshold) would likely perform on each item (e.g., Angoff, Ebel, Nedelsky, Jaeger).
- Examinee-centerd methods Consider actual examinee performance data to determine the cutoff.
- Compromise methods Combine both norm-referenced and criterion-referenced approaches.
- Statistical methods Use statistical approaches such as linear regression.
Standard setters—the individuals establishing the standard—should:
- Understand the test’s objectives.
- Know why the cutoff is being set.
- Have content expertise.
- Know the students (i.e., their typical performance level).
Test-centered methods
These are commonly used for setting cut scores based on the exam items themselves.
Angoff’s method
One of the most widely used methods. The steps are:
- Individual estimation: Each judge estimates the probability (0–100%) that a borderline candidate would answer each item correctly.
- Group discussion: The judges discuss their item estimates together. You can have any number of judges, typically 6–8.
- Revisions: Judges can revise their estimates after the discussion.
- Repeat for all items: Every item on the test goes through this process.
The Standard (Cut score) is obtained by summing the average probabilities across all items.
Example Calculation
| Judge | 1 | 2 | 3 |
|---|---|---|---|
| Item 1 | 0.65 | 0.60 | 0.75 |
| Item 2 | 0.60 | 0.40 | 0.60 |
| Item 3 | 0.25 | 0.10 | 0.35 |
| Item 4 | 0.10 | 0.05 | 0.55 |
| Item 5 | 0.30 | 0.20 | 0.40 |
| Overall | 1.9 (2/5) | 1.35 (1/5) | 2.65 (3/5) |
MPL = (1.9 + 1.35 + 2.65) ÷ 3 = 1.97 ≈ 2 out of 5 items
Steps:
- Each judge estimates the probability that a borderline candidate would answer each of the 5 items correctly.
- Sum the probabilities for each judge across all items.
- Sum across all judges.
- Divide by the total number of judges.
Advantage
- Straightforward.
- Item-based approach.
- Evidence-based.
- Good for competency or licensing exams.
Disadvantages
- Judges may disagree on probabilities.
- Time-consuming.
Modified-Angoff’s method
A variation where judges simplify the probability estimate to either 0 or 1 for each item, indicating whether they believe a borderline candidate will answer correctly or not.
Example (Based on the Angoff Example Above)
| Judge | 1 | 2 | 3 |
|---|---|---|---|
| Item 1 | 1 | 1 | 1 |
| Item 2 | 1 | 0 | 1 |
| Item 3 | 0 | 0 | 0 |
| Item 4 | 0 | 0 | 1 |
| Item 5 | 0 | 0 | 0 |
| Overall | 2 (2/5) | 1 (1/5) | 3 (3/5) |
The MPL is again 2 out of 5 items in this example.
Ebel’s method
Classifies items by two dimensions:
- Difficulty: Easy, Average, Difficult
- Content Relevance: Essential, Important, Acceptable, Questionable
Then uses Angoff’s approach to estimate how likely a borderline student is to get each item correct, and factors in the content relevance.
Steps:
- Use Angoff’s Method to estimate the probability of a borderline student getting each item right.
- Classify items into Easy, Average, or Difficult.
- Also classify their relevance as Essential, Important, Acceptable, or Questionable.
- Calculate the mean probability for each cell in the classification table.
- Multiply those mean probabilities by the number of items in each cell.
- Sum all results across the table, then divide by the total number of items to get the MPL.
Example (After Step 4)
| Easy (items) | Average (items) | Difficult (items) | |
|---|---|---|---|
| Essential | 0.85 (5) | 0.65 (10) | 0.25 (5) |
| Important | 0.75 (5) | 0.55 (5) | 0.15 (5) |
| Acceptable | 0.65 (3) | 0.45 (4) | 0.10 (3) |
| Questionable | 0.65 (2) | 0.40 (2) | 0.05 (1) |
Example Calculation (Step 5)
(0.85 x 5) + (0.65 x 10) + (0.25 x 5) + (0.75 x 5) + (0.55 x 5) + (0.15 x 5) + (0.65 x 3) + (0.45 x 4) + (0.10 x 3) + (0.65 x 2) + (0.40 x 2) + (0.05 x 1) = 25.45
Then, dividing by the total of 50 items gives MPL = 25.45 ÷ 50 = 50%.
Modified-Ebel’s method
This variation simplifies the classification into three relevance categories: Must know (Essential), Should know (Important), Good to know (Indicate).
It also uses an Answer Index (AI) derived from analyzing each item’s options:
- A correct option is given 2 points.
- For each distractor, judges estimate how likely a borderline student would choose it, assigning 0 for very unlikely up to just under 2 for highly likely.
- AI = 2 ÷ (sum of weights for all options in that item).
- The lower the AI, the harder the item; higher AI indicates an easier item.
A table then maps the AI to categories
| AI | |
|---|---|
| Must know | 0.6 - 0.8 |
| Should know | 0.4 - 0.59 |
| Good to know | 0.2 - 0.39 |
Finally, each judge estimates how many items a borderline candidate should answer correctly at each relevance level and difficulty.
Nedelsky Method
Focused on how many incorrect options a borderline student can eliminate in multiple-choice questions. For an MCQ with 5 options, if a borderline student can eliminate 1 option, 4 remain, so the probability is 1/4 = 0.25. If they can eliminate 2, the probability is 1/3 ≈ 0.33, and so on.
- Eliminate 1/5 = remaining 4 >> 1/4 = 0.25
- Eliminate 2/5 = remaining 3 >> 1/3 = 0.33
- Eliminate 3/5 = remaining 2 >> 1/2 = 0.5
- Eliminate 4/5 = remaining 1 >> 1/1 = 1
Example Table
| Judge | 1 | 2 | 3 |
|---|---|---|---|
| Item 1 | 0.50 | 0.33 | 1.0 |
| Item 2 | 0.50 | 0.33 | 0.50 |
| Item 3 | 0.25 | 0.20 | 0.33 |
| Item 4 | 0.33 | 0.20 | 0.50 |
| Item 5 | 0.33 | 0.20 | 0.33 |
| Overall | 1.91 (2/5) | 1.26 (1/5) | 2.66 (3/5) |
Then, add up the total for all judges across all items and divide by the number of judges to get the MPL. In this example, MPL ≈ 2 out of 5 items.
Bookmark Method
A method that sets a “bookmark” for the cutoff:
- Calculate the difficulty index (e.g., Angoff) for each item. Sort items from easiest to hardest.
- Judges “place a bookmark” where they believe the borderline student’s ability ends.
- Let X be the average of these bookmark positions (or difficulty values).
- MPL = (X × 100) ÷ total number of items.
Examinee-centered Method
Borderline group Method
Often used in OSCEs, where each student’s performance is scored using both an itemized checklist and a global rating scale.
Steps
- Use the global rating scale to identify borderline students.
- Calculate the mean score among this borderline group.
- Plot all students’ scores as a distribution curve.
- Highlight the borderline group’s distribution as a separate curve.
- Take the mean of the borderline group as the MPL.
Contrasting group Method
Plot the distributions for two groups: those considered “fail” and those considered “pass.” The cutpoint is where the two distributions intersect.

Here, the blue curve represents the failing group and the orange curve the passing group. The intersection point is the MPL 9
Borderline regression Method
Also used in OSCEs by incorporating both global rating scales and checklist scores10
Steps
- Plot each student’s performance on a graph, grouped by global rating scale (X-axis).
- Perform a regression line across data from all rating levels.
- The borderline MPL is found by drawing a vertical line from the “borderline” rating category to meet the regression line, then dropping to the Y-axis.

Compromise Method: Hofstee Method
Requires four values:
- Maximum acceptable failure rate.
- Minimum acceptable failure rate.
- Maximum cut score.
- Minimum cut score.
Steps to find the MPL:
- On a graph, let the X-axis be possible scores and the Y-axis be the cumulative number of students achieving those scores.
- Draw a straight line from the point (min cut score, max failure rate) to (max cut score, min failure rate).
- The point at which the cumulative student curve intersects this line on the X-axis is the MPL.

In this example, the MPL is about 38% 11
Footnotes
-
Accuracy of physician self-assessment compared with observed measures of competence: a systematic review ↩
-
Educational theories you must know. Miller’s pyramid. St.Emlyn’s ↩
-
Assessing professional competence: from methods to programmes ↩
-
Contrasting groups’ standard setting for consequences analysis in validity studies: reporting considerations ↩
-
Designing and developing an app to perform Hofstee cut-off calculations ↩